Pew Research Center recently published a short study on how wages look when adjusted by different inflation measures.
The takeaway is that, depending on which CPI measure you use to adjust for inflation, the median wage’s real buying power grew by somewhere between 11.5% and 20% from 1999 to 2025. That is a huge range.
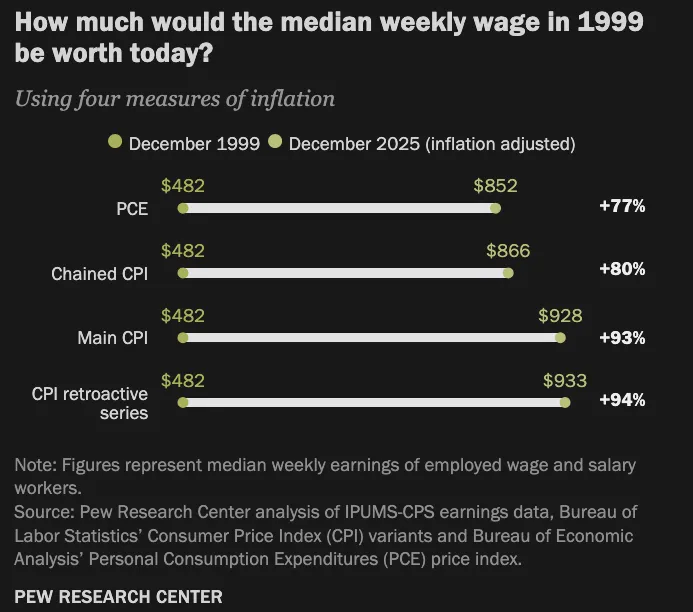
How much did purchasing power grow?#
Using CPI-U1 as the measure, the study says:
Over that span, the median wage’s real buying power grew by 12.1%.
That seems shocking — surely U.S. worker productivity has gone up by far more than 12.1% from 1999 to 2025, right?
To check my intuitive reaction, I looked up two numbers:
- A direct measure of labor productivity from the U.S. Bureau of Labor Statistics
- Real GDP from FRED
BLS publishes nonfarm productivity changes going all the way back to 1947. At the time I accessed it, the average annual percentage change from 1947 to 2026 was 2.2%. Broken down by period:
- 2001 - 2007: 2.8
- 2007 - 2019: 1.5
- 2019 - 2026: 2.1
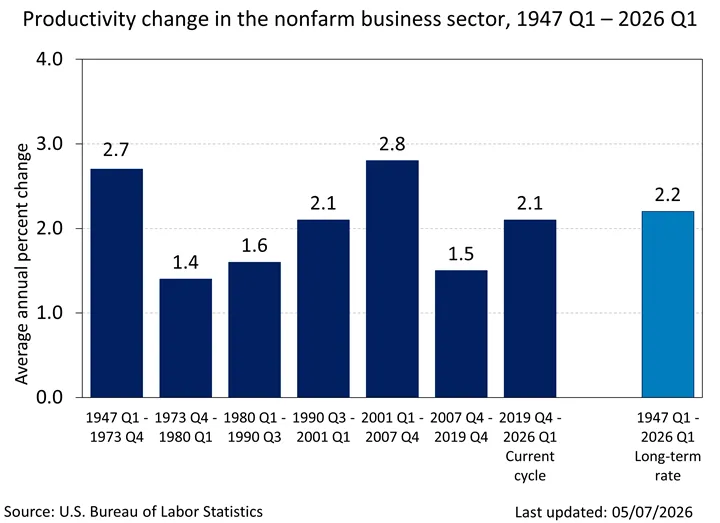
If we use a rough annual growth rate of 2%, then from 1999 to 2025:
That is roughly 67% productivity growth, far exceeding the 12% purchasing-power growth number.
What about Real GDP?
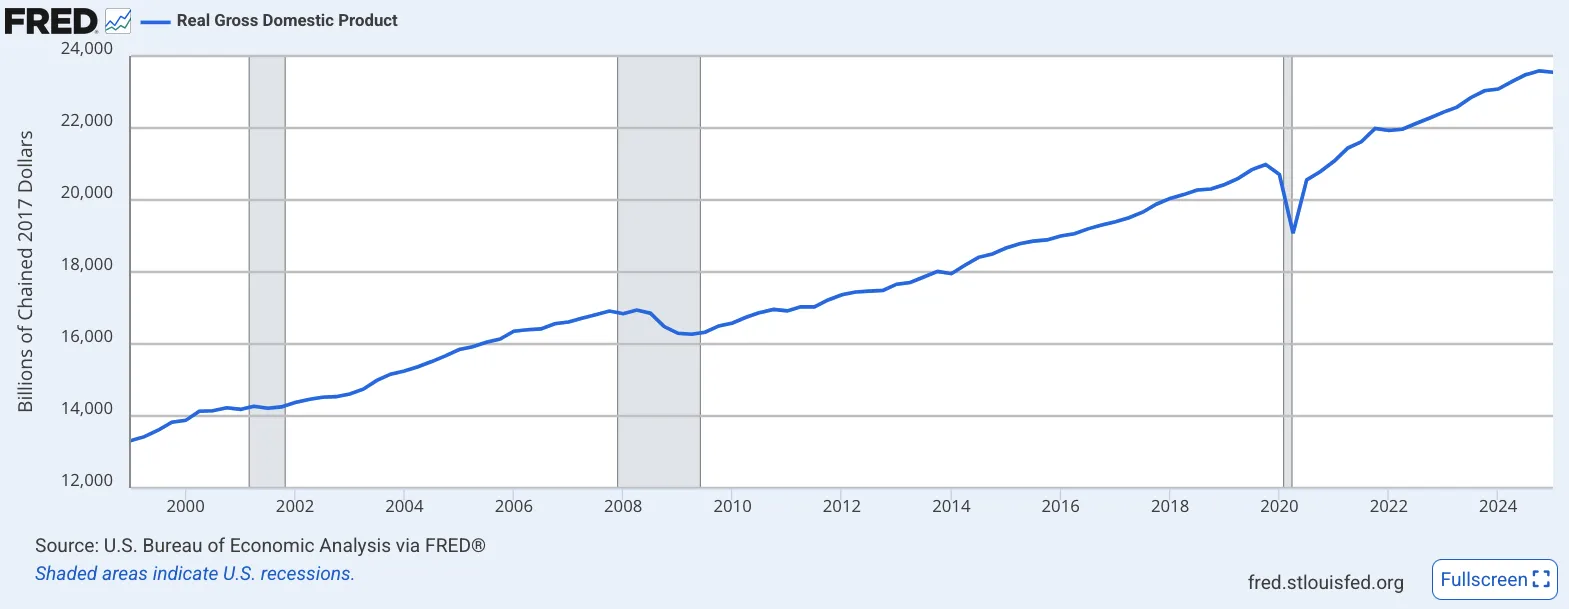
If we approximate productivity growth with real GDP2, using numbers published by FRED, Q1 1999 had about $13,315 billion in 2017 dollars, while Q1 2025 had $23,548 billion in 2017 dollars. That gives us:
76% is not 67%, but neither number is close to 12%.
Conclusion#
WELP.